 at
at Red Sox at Pirates
Boston
Red Sox
Pittsburgh
Pirates
Post Game SummaryStat Savant
atRed Sox at PiratesThe model favors the Red Sox 5-4, with the line sitting at BOS -144 and the total at 8, and Jake Bennett's edge on the mound over Bubba Chandler backs up the pick.
Bennett brings a 3.17 ERA and 1.04 WHIP against Chandler's 4.26 ERA and 1.38 WHIP, a clear gap in command and run prevention. If Bennett works deep, Boston's bullpen stays fresh while Pittsburgh has to scratch for offense against a pitcher who isn't beating himself.
Neither club has found much rhythm lately: the Red Sox have won just 1 of their last 5, the Pirates 2 of their last 5.
Contreras paces Boston with 24 home runs and Lowe leads Pittsburgh with 25, giving both lineups a legitimate power threat in the middle of the order. Neither pitching staff can afford to pitch around one slugger and forget the other.
Pittsburgh actually took the season series 2-1, a wrinkle that cuts against the model's lean tonight. History says the Pirates have found ways to get to Boston even when the numbers say they shouldn't.
Bennett leans on his changeup as a put-away pitch, generating a 34% whiff rate, backed by a heavy diet of 4-seamers and changeups at 34% and 26% usage. That two-pitch mix forces Pittsburgh's hitters to sit on the fastball and still adjust down in the zone.
Rafaela's .288 average tops Boston while Gonzales' .309 leads Pittsburgh, giving each side a table-setter who can keep innings alive. Whichever contact bat gets on base more often gives their power hitters more chances to do damage.
The Pirates sit 4th in the NL Central, 18 games back, coming off a loss, 5-5 over their last 10. The Red Sox sit 3rd in the AL East, 6 games back, coming off a loss, 7-3 over their last 10.
The Pirates are up next at Cardinals (Aug 28-30). The Red Sox are up next at Yankees (Aug 28-29).
We ranked every clip from this game by how much it swung the win probability, kept the biggest, and play them back in the order they happened. Pick any play to jump straight to it.
Ranked by win probability added: how far each player's plays moved this game's odds, not how their box-score line reads. A single with the bases loaded in the ninth outranks a home run in a blowout, because that is what actually decided it.

 Red Sox to winMissBOS -1.5 · 52%Upset
Graded against the closing line across 6 books.
Runs by inning across the top, then every batter and pitcher underneath. The pills switch clubs; the totals column is each side’s own line, not a comparison.
| Inn | 1 | 2 | 3 | 4 | 5 | 6 | 7 | 8 | 9 | R | H | E |
|---|---|---|---|---|---|---|---|---|---|---|---|---|
| BOSBoston Red Sox | 0 | 0 | 0 | 0 | 2 | 0 | 1 | 0 | 1 | 4 | 9 | 1 |
| PITPittsburgh Pirates | 0 | 1 | 0 | 3 | 3 | 0 | 1 | 0 | 8 | 9 | 1 |
| Player | H-AB | AB | R | H | RBI | HR | BB | K | #P | AVG | OBP | SLG |
|---|---|---|---|---|---|---|---|---|---|---|---|---|
 Nick Sogard Nick Sogard | 2-4 | 4 | 0 | 2 | 2 | 0 | 0 | 0 | 17 | .258 | .369 | .333 |
 Masataka Yoshida Masataka Yoshida | 2-5 | 5 | 0 | 2 | 1 | 0 | 0 | 2 | 22 | .272 | .346 | .395 |
 Adley Rutschman Adley Rutschman | 0-5 | 5 | 0 | 0 | 0 | 0 | 0 | 3 | 26 | .244 | .329 | .419 |
 Willson Contreras Willson Contreras | 1-3 | 3 | 0 | 1 | 0 | 0 | 1 | 1 | 15 | .281 | .390 | .527 |
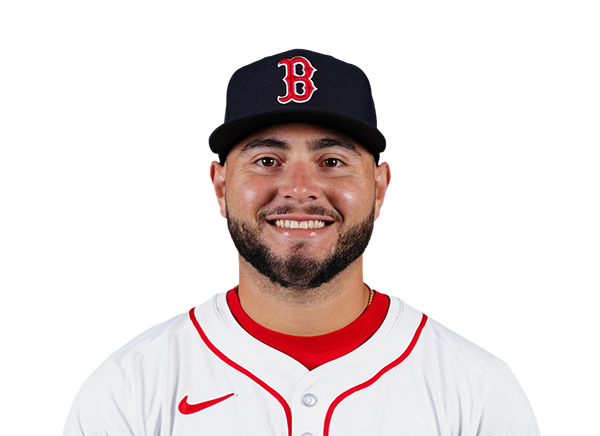 Wilyer Abreu Wilyer Abreu | 1-4 | 4 | 0 | 1 | 0 | 0 | 0 | 0 | 14 | .254 | .332 | .462 |
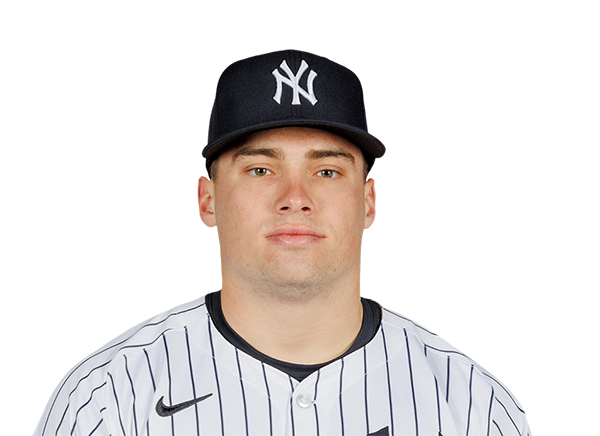 Caleb Durbin Caleb Durbin | 0-3 | 3 | 1 | 0 | 0 | 0 | 1 | 0 | 11 | .251 | .321 | .407 |
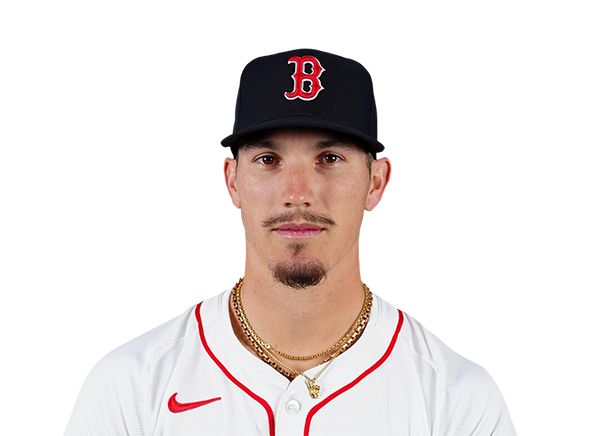 Jarren Duran Jarren Duran | 1-3 | 3 | 2 | 1 | 0 | 0 | 1 | 2 | 19 | .202 | .261 | .354 |
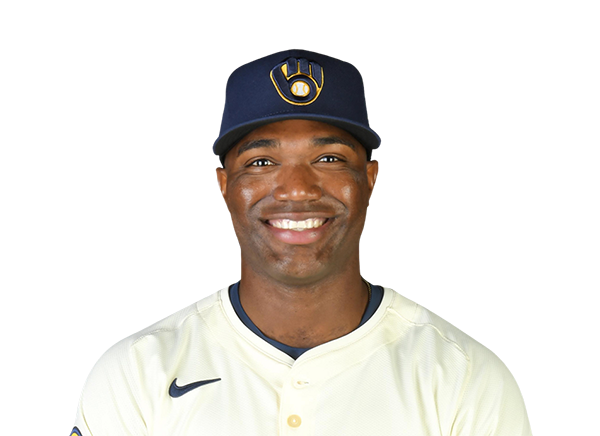 Andruw Monasterio Andruw Monasterio | 1-3 | 3 | 0 | 1 | 1 | 0 | 1 | 0 | 16 | .270 | .333 | .443 |
 Eli White Eli White | 1-4 | 4 | 1 | 1 | 0 | 0 | 0 | 2 | 21 | .236 | .288 | .392 |
| Player | IP | H | R | ER | BB | K | HR | PC-ST | ERA | PC |
|---|---|---|---|---|---|---|---|---|---|---|
 Jake Bennett Jake Bennett | 4.0 | 5 | 4 | 4 | 1 | 6 | 1 | 82-52 | 3.46 | 82 |
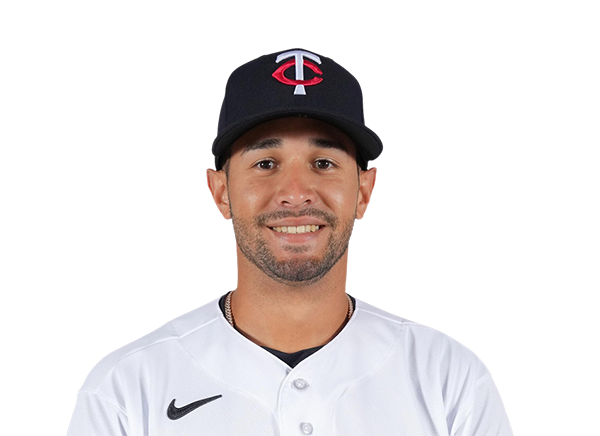 Jovani Moran Jovani Moran | 1.0 | 2 | 3 | 3 | 0 | 2 | 1 | 27-20 | 3.00 | 27 |
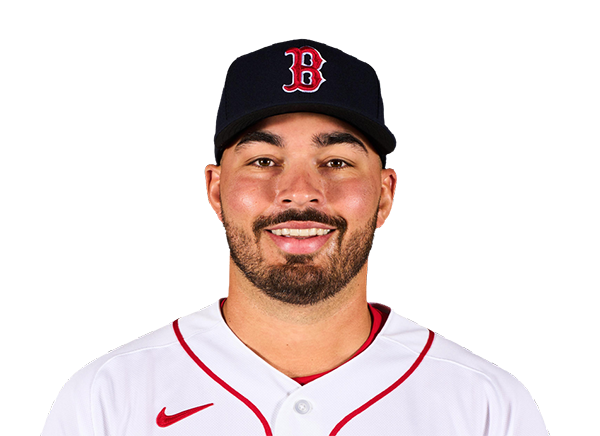 Alec Gamboa Alec Gamboa | 3.0 | 2 | 1 | 0 | 0 | 0 | 0 | 36-22 | 1.59 | 36 |
Every plate appearance as it happened, newest first, with the scoring plays called out. Baseball Savant gamefeed.
| Inn | Play | Win probability | Swing |
|---|---|---|---|
| T9 | PIT 100.0 | 1.1 | |
| T9 | PIT 98.9 | 0.8 | |
| T9 | PIT 99.7 | 0.2 | |
| T9 | PIT 99.9 | — | |
| T9 | PIT 99.9 | 0.1 | |
| T9 | PIT 99.8 | 0.4 | |
| B8 | PIT 99.4 | 0.1 | |
| B8 | PIT 99.5 | 0.1 |
Win probability after each plate appearance, with the side in front named. Swing is how far that plate appearance moved it. Plays that scored a run are set in bold. Baseball Savant gamefeed.
The full ladder, with both clubs marked.



























