 at
at Nationals at Mets
Washington
Nationals
New York
Mets
Post Game SummaryStat Savant
atNationals at MetsThe Mets scratched across the go-ahead run in the ninth and held on to edge the Nationals 5-4. Lindor's single brought Pache home and pushed Robert Jr. to third, and Young paced the offense going 2-for-4 with two RBI. New York out-hit Washington 8-7 and improved to 55-69, while the Nationals slipped to 60-65. The Mets host the Nationals again Sunday, with Washington making the trip.
Lindor's single to right in the ninth scored Pache and sent Robert Jr. to third, giving the Mets the go-ahead run in a 5-4 win over the Nationals.
Young led the way for New York, going 2-for-4 with two RBI, and the Mets held the edge in hits, 8 to 7.
The result pushed the Mets to 55-69 while the Nationals fell to 60-65, with New York now ahead 5-4 in the season series.
The Mets sit 5th in the NL East, 18 games back, coming off a loss, 6-4 over their last 10. The Nationals sit 4th in the NL East, 16½ games back, coming off a win, 3-7 over their last 10.
The Mets are up next home vs Brewers (Aug 27), then home vs Astros. The Nationals are up next home vs Marlins (Aug 28-30).
We ranked every clip from this game by how much it swung the win probability, kept the biggest, and play them back in the order they happened. Pick any play to jump straight to it.
Ranked by win probability added: how far each player's plays moved this game's odds, not how their box-score line reads. A single with the bases loaded in the ninth outranks a home run in a blowout, because that is what actually decided it.

 Mets to winHitNYM -1.5 · 56%Held
Graded against the closing line across 6 books.
Runs by inning across the top, then every batter and pitcher underneath. The pills switch clubs; the totals column is each side’s own line, not a comparison.
| Inn | 1 | 2 | 3 | 4 | 5 | 6 | 7 | 8 | 9 | R | H | E |
|---|---|---|---|---|---|---|---|---|---|---|---|---|
| WSHWashington Nationals | 0 | 0 | 0 | 1 | 0 | 3 | 0 | 0 | 0 | 4 | 7 | 0 |
| NYMNew York Mets | 2 | 0 | 0 | 0 | 0 | 1 | 0 | 0 | 2 | 5 | 8 | 0 |
| Player | H-AB | AB | R | H | RBI | HR | BB | K | #P | AVG | OBP | SLG |
|---|---|---|---|---|---|---|---|---|---|---|---|---|
 Dylan Crews Dylan Crews | 0-4 | 4 | 0 | 0 | 0 | 0 | 0 | 1 | 14 | .214 | .285 | .365 |
 Andres Chaparro Andres Chaparro | 1-2 | 2 | 2 | 1 | 1 | 1 | 1 | 1 | 14 | .231 | .352 | .500 |
 Abimelec Ortiz Abimelec Ortiz | 1-1 | 1 | 0 | 1 | 0 | 0 | 0 | 0 | 3 | .306 | .324 | .667 |
 Brady House Brady House | 1-4 | 4 | 1 | 1 | 3 | 1 | 0 | 2 | 18 | .242 | .295 | .408 |
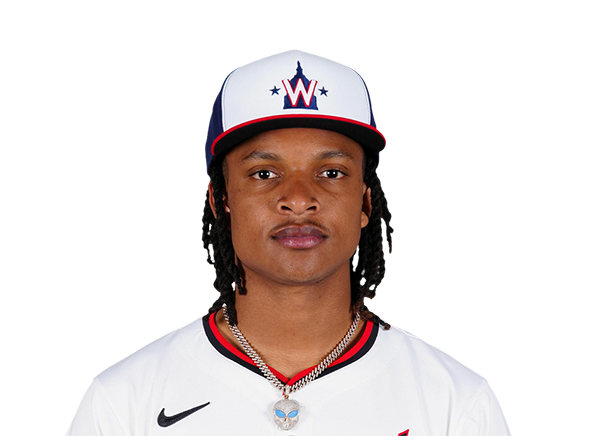 CJ Abrams CJ Abrams | 0-4 | 4 | 0 | 0 | 0 | 0 | 0 | 0 | 11 | .280 | .357 | .534 |
 Harry Ford Harry Ford | 0-3 | 3 | 0 | 0 | 0 | 0 | 1 | 2 | 19 | .213 | .327 | .447 |
 Jacob Young Jacob Young | 2-4 | 4 | 0 | 2 | 0 | 0 | 0 | 1 | 14 | .251 | .314 | .406 |
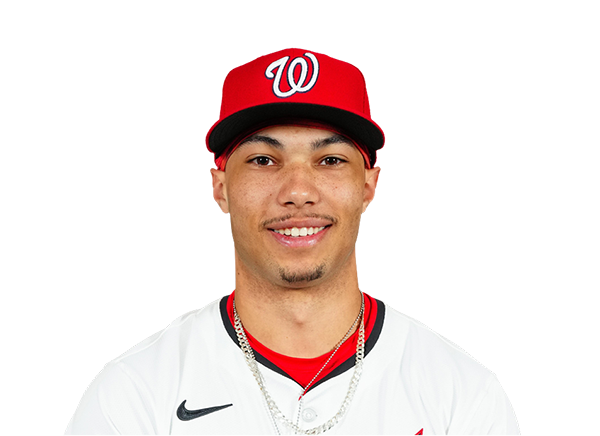 Daylen Lile Daylen Lile | 0-4 | 4 | 0 | 0 | 0 | 0 | 0 | 2 | 13 | .247 | .295 | .413 |
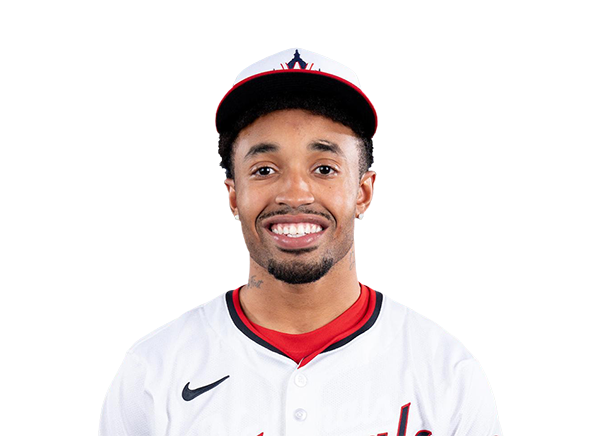 Nasim Nunez Nasim Nunez | 1-4 | 4 | 0 | 1 | 0 | 0 | 0 | 1 | 12 | .228 | .313 | .265 |
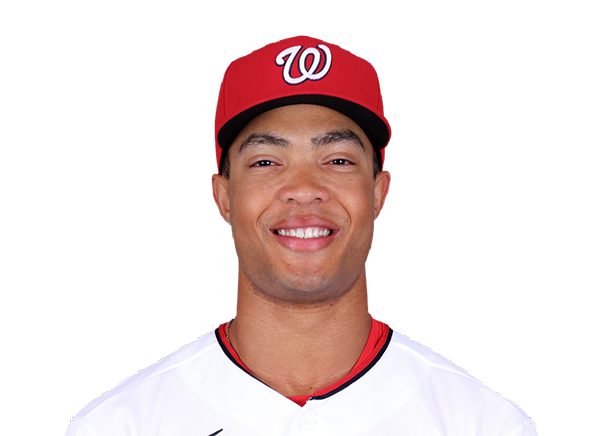 Andrew Pinckney Andrew Pinckney | 1-2 | 2 | 1 | 1 | 0 | 0 | 0 | 1 | 8 | .300 | .385 | .800 |
| Player | IP | H | R | ER | BB | K | HR | PC-ST | ERA | PC |
|---|---|---|---|---|---|---|---|---|---|---|
 Brad Lord Brad Lord | 0.2 | 1 | 2 | 2 | 4 | 1 | 0 | 44-21 | 4.04 | 44 |
 Will Dion Will Dion | 4.1 | 0 | 0 | 0 | 1 | 7 | 0 | 64-41 | 3.25 | 64 |
 Tom Cosgrove Tom Cosgrove | 1.0 | 2 | 1 | 1 | 0 | 1 | 1 | 9-7 | 3.75 | 9 |
 Orlando Ribalta Orlando Ribalta | 1.0 | 0 | 0 | 0 | 0 | 1 | 0 | 17-9 | 3.41 | 17 |
 Clayton Beeter Clayton Beeter | 1.0 | 2 | 0 | 0 | 1 | 1 | 0 | 19-11 | 3.55 | 19 |
 Yovanny Cruz Yovanny Cruz | 0.1 | 3 | 2 | 2 | 1 | 1 | 0 | 23-13 | 6.48 | 23 |
Every plate appearance as it happened, newest first, with the scoring plays called out. Baseball Savant gamefeed.
| Inn | Play | Win probability | Swing |
|---|---|---|---|
| B9 | NYM 100.0 | 15.7 | |
| B9 | NYM 84.3 | 7.9 | |
| B9 | NYM 92.2 | 40.7 | |
| B9 | NYM 51.5 | 17.6 | |
| B9 | WSH 66.1 | 13.5 | |
| T9 | WSH 79.6 | 1.0 | |
| T9 | WSH 80.6 | 1.3 | |
| T9 | WSH 81.9 | 1.6 |
Win probability after each plate appearance, with the side in front named. Swing is how far that plate appearance moved it. Plays that scored a run are set in bold. Baseball Savant gamefeed.
The full ladder, with both clubs marked.



























